
Production Planner: Graph, Table, Build Cost and bottlenecks
The Production Planner is FluxWerks' built-in factory calculator, and it has four tabs — Graph, Table, Build Cost and Farming — plus a target panel, a node graph and a summary rail. Its most useful feature is the bottleneck it names for you; its most important limitation is the disclaimer it prints about itself.
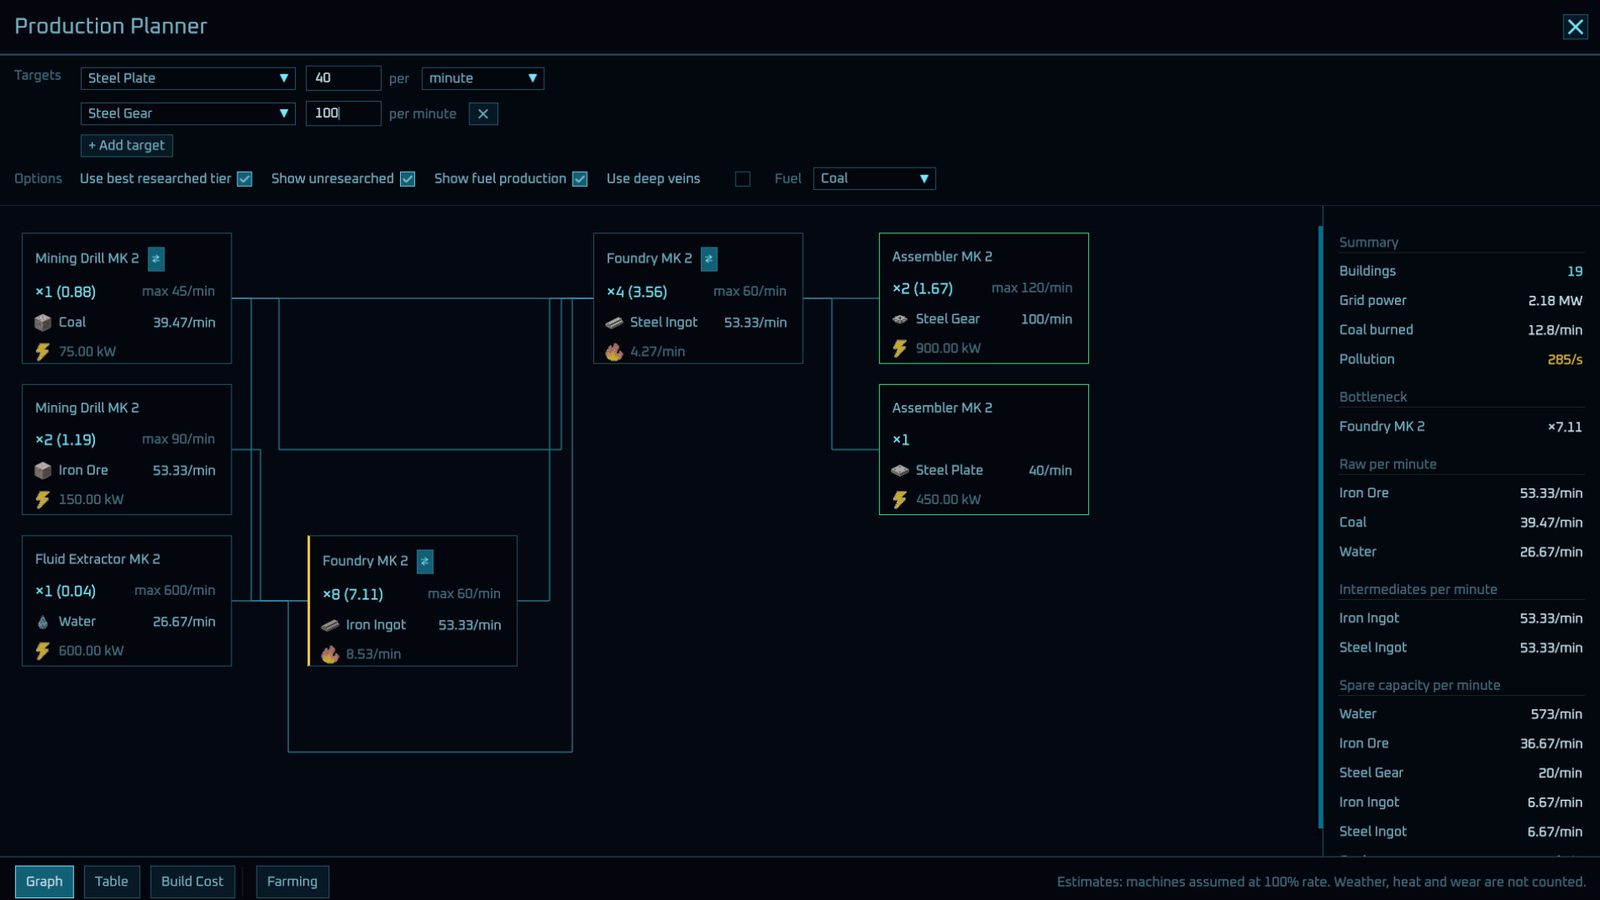
How the planner is laid out
Reading the official screenshot of the tool, the layout is fixed:
| Region | What is in it | What you use it for |
|---|---|---|
| Top control panel | Production Planner title, close button, Targets list with + Add target | Declaring what you want to make and how much |
| Options row | Checkboxes: use best researched tier, show unresearched, show fuel production, use deep veins; a Fuel dropdown (default Coal) | Filtering the plan to what you have actually unlocked |
| Centre graph | Machine nodes joined by thin cyan lines | Seeing the chain: resources → intermediates → products |
| Right rail (Summary) | Total buildings, Grid power, Coal burned, Pollution, Bottleneck, raw/intermediate rates, spare capacity | The numbers you act on |
| Bottom tabs | Graph · Table · Build Cost · Farming | Switching how the same plan is displayed |
What a node tells you
Each machine box in the graph carries five pieces of information, all visible in the official screenshot:
- Machine name and tier —
Mining Drill MK 2,Foundry MK 2,Assembler MK 2. - Count and load —
x1 (0.88). The number in brackets is how loaded that machine is, not how many you own. - Input / output rates — for example
39.47/min, with resource icons: a cube for coal, a rock for iron ore, a drop for water, a bar for ingots and plates. - Power draw — a lightning bolt with
75.00 kWor600.00 kW. - Fuel burn — a flame with
8.53/min, shown where the step consumes fuel.
The lines between nodes are the plan's flow, drawn left to right: raw resources feed machines that feed the next tier, until the target is satisfied.
The summary rail: where the decisions are
| Summary field | Example value | What it means |
|---|---|---|
| Total buildings | 19 | How many machines this plan requires |
| Grid power | 2.18 MW | Total draw — your generation target |
| Coal burned | 12.8/min | Fuel the plan consumes |
| Pollution | 285/s | Printed in amber, the planner's caution colour |
| Bottleneck | Foundry MK 2, x7.11 | The one machine limiting everything else |
| Spare capacity | listed per resource | What you are producing more of than the plan needs |
The bottleneck line is the one to read first. A multiplier like x7.11 on a single machine means the rest of the chain is waiting on it — expand that, not the machine you happened to notice was idle.
v0.5.16 regrouped Production Statistics: fluids sit above items with a line between them, and each group's bars compare only within the group. A fat fluid bar next to a thin item bar is no longer a ranking — they are on different scales.
The four tabs, and when each one helps
- Graph — the default visual chain. Use it to understand structure and to find the bottleneck.
- Table — the same plan as rows. Use it to compare rates without following lines.
- Build Cost — what you have to craft or carry before the plan can exist. Use it before you commit to a build.
- Farming — the agricultural side of supply, which matters from
v0.5.0onward (that patch is titled "End game goal, events, farming..."). Sincev0.5.20(October 17) the Farming tab also lists the Harvesters each crop needs and has a Floors slider for crops that grow under cover.

The planner exists for layouts like this one. Once a base spans more than a couple of machines, counting by eye stops working — which is what the Table and Build Cost tabs are for.
Using it in the first hour
Set two targets early — the official screenshot illustrates Steel Plate 40/min and Steel Gear 100/min; choose targets that match your current factory. Then check three things in order: bottleneck, grid power, fuel burn. Ignore the node that looks impressive and fix the one the summary names.
Recheck farms and extraction after v0.5.20
The Farming tab now lists the Harvesters each crop needs and offers a Floors slider for covered crops. Set the floor count to match the intended farm, then use the listed Harvester demand instead of assuming one machine covers every scale. v0.5.20 fixes missing Biomass farms and plans showing one Planter or far too many Harvesters for a large farm.
For an existing farm, select its Planter: the panel shows what the field ripens and how many Harvesters that takes. Planters now sow dirt floors in their square at any height, nearest first, replacing the old 20-block vertical reach. Planter and Harvester cards show speed and area; both machines now correctly account for wear.
Recalculate deep-extraction plans using 22.5 items/min or 100 water units/min, 1.2 MW and 1.5 MB/s per extractor. These are separate from a planner screenshot's example targets. A screenshot showing Steel Plate 40/min or Steel Gear 100/min illustrates one plan; it is not a mandatory opening quota.
For Foundry recipes, Electric Foundry is an alternative after Electric Smelting, researched after Logistics II. It runs on grid power without fuel, works twice as fast as Foundry MK 2 and has a Flux Core slot. Compare the extra grid demand before replacing a fuel-fed chain.
After building, compare actual throughput with the plan. The planner assumes 100% machine rate and excludes weather, heat and wear; those exclusions call for checking the running factory rather than treating the estimate as guaranteed production. Official v0.5.20 notes.
Next: Beginner: First Hour · Logistics & Drones · FAQ & Known Issues